Monitoring and graphing signal strength on a Wavecom serial GSM modem using perl and cacti.
Todays problem:
Frequent errors and dropouts on a Wavecom 900E GSM modem we use to send SMS alerts to our engineering team.
Following on from a spell of frustrating problems with one of our alerting systems I decided to see if I could graph the received signal strength on our GSM modem to determine if that was the cause.
From the dusty corners of my mind I remember using kermit to speak hayes AT commands to similar modems – taking me back to dial-up days…
Using minicom I could connect to the unit and issue all the AT commands I could remember 🙂
Digging around for a reference manual on the internet for our particular gsm modem I found the command I was looking for: AT+CSQ. This returns two values:
RSSI or received signal strength which is a 5 bit binary value – 0-31 decimal. 0-10 is bad, 11-20 is average and 21-31 is excellent.
BER or Bit Error Rate – this is a 3 bit value – 0-7. It's a percentage of the errored bits in a particular sample interval. Not sure what the interval is but that doesn't matter as we can safely infer that 0 = no errors, 4 = 50% errors, 7 = 100% errors.
This showed me that the signal was fluctuating. It would look good on a graph – which meant I would need a script for cacti to call.
After a spell of attempting to programatically obtain this information using a shell script it was time to roll out the Perl. Like most problems someone has already written a module to make your life easier. In this case, that module is Device::Modem. The quickest way to install these modules is with cpanminus to take care of all the depenancies etc – so install that first:
/home/james $ cpan App::cpanminus
Then the module in question:
/home/james $ cpanm Device::Modem
--Working on Device::Modem
Fetching http://www.cpan.org/authors/id/C/CO/COSIMO/Device-Modem-1.56.tar.gz ... OK
Configuring Device-Modem-1.56 ... OK
Found dependencies: Device::SerialPort
--Working on Device::SerialPort
Fetching http://www.cpan.org/authors/id/C/CO/COOK/Device-SerialPort-1.04.tar.gz ... OK
Configuring Device-SerialPort-1.04 ... OK
Building and testing Device-SerialPort-1.04 ... OK
Successfully installed Device-SerialPort-1.04
Building and testing Device-Modem-1.56 ... OK
Successfully installed Device-Modem-1.56
2 distributions installed
Smashing. A look at the module page on CPAN gives us all the methods we can use. I played with some to test things were working – the only gotcha being the baud rate is hardcoded in the examples that are helpfully provided so watch out for that.
A quick bit of sysadmin-grade* perl-mashing later and I had this:
#!/usr/bin/perl

# get_gsm_signal.pl
# jp - 01082013
# Connects to wavecom gsm modem on /dev/ttyS0.
# Issues AT+CSQ command to get RSSI and BER
# Outputs ready for collection by cacti.

use Device::Modem;

my $modem = new Device::Modem( port => '/dev/ttyS0' );

if( $modem->connect( baudrate => 9600 ) ) {
  } else {
      print "sorry, no connection with serial port!\n";
  }

# Reset the modem, then send in the AT commands.
# Use the builtin carriage return function - or have a bad time.

$modem->atsend( 'AT+CSQ' . Device::Modem::CR );
$csq = $modem->answer();

# Some wrangling - its content over style I'm afraid

$csq =~ s/OK//g;

# Remove all newline chars to get sensible output.
$csq =~ s/\r\n//g;

$csq =~ s/^\+CSQ\:\ //;
my($sig, $ber) = split(/,/, $csq, 2);

# Finally output in a format that cacti expects

print "SIG:$sig BER:$ber\n";
Which I could run all day long and reliably produces the data we need.
/home/james $ /var/www/cacti/scripts/get_gsm_signal.pl

SIG:13 BER:0
Step 2 – Cacti.
The method below works for me – however like its namesake, Cacti is multi-pronged spiky beast sometimes !
The first step is to log into your cacti installation as an admistrator and click on the console tab, then click on 'Data Input Methods' and finally Add – which is at the top right of the page:
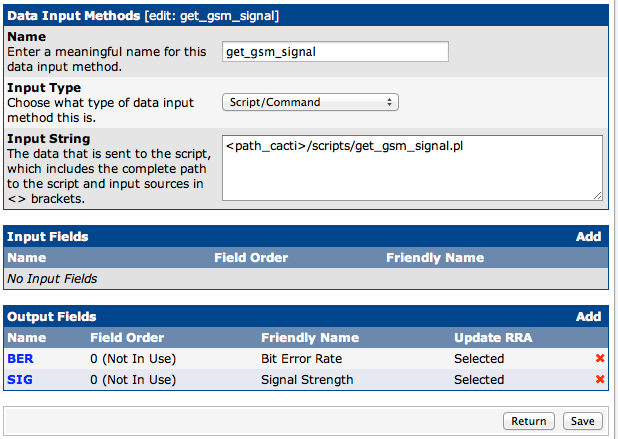
Fill out the blanks on the page. The input type should be Script/Command and be sure that the user your cacti poller is running as has the permissions to execute the script – In my case I had to add the cacti user to the uucp group to allow it access to the serial ports. You can also use the <path_cacti> variable to make things easier – I believe that's /var/www/cacti by default. Once done, click create and the page will refresh with some more options. As our script just needs to be executed to produce the output we want there are no input fields. We need to add two output fields – be sure to name them to match the output of our script – in this case SIG and BER. The friendly names can be anything you fancy. Once you're done, you should have something like this:
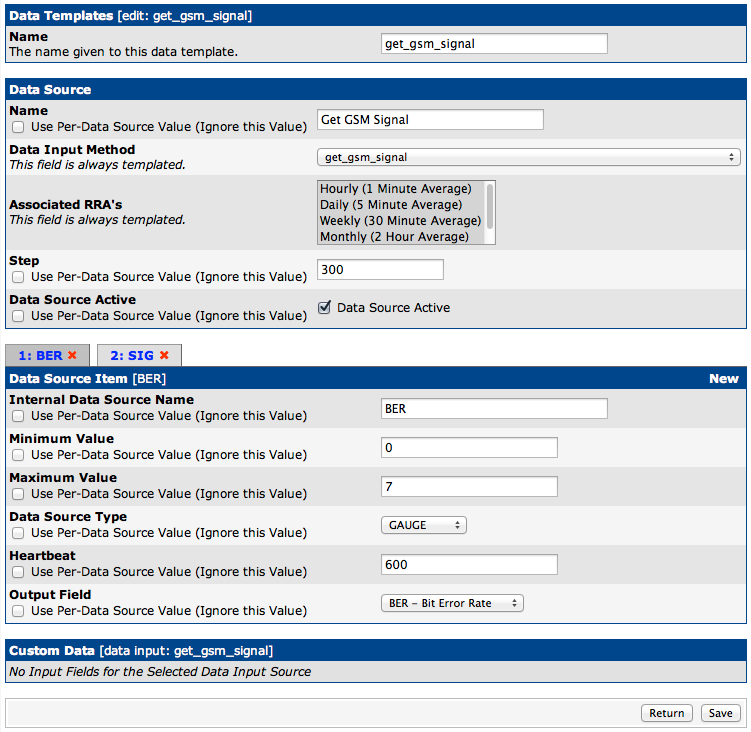
Next step – create a Data Template. Click on Data Templates on the sidebar, and then 'Add'. Again, fill in the blanks, selecting the Data Input Method we've previously created, making sure it's active and then clicking create. Once the page refreshes you should see the two variables we're interested in created as Data Source Items at the bottom of the page. You can set reasonable maximums for the values here, and it's also worth checking that the output fields match up with the names. Once you're done, it should look like this:
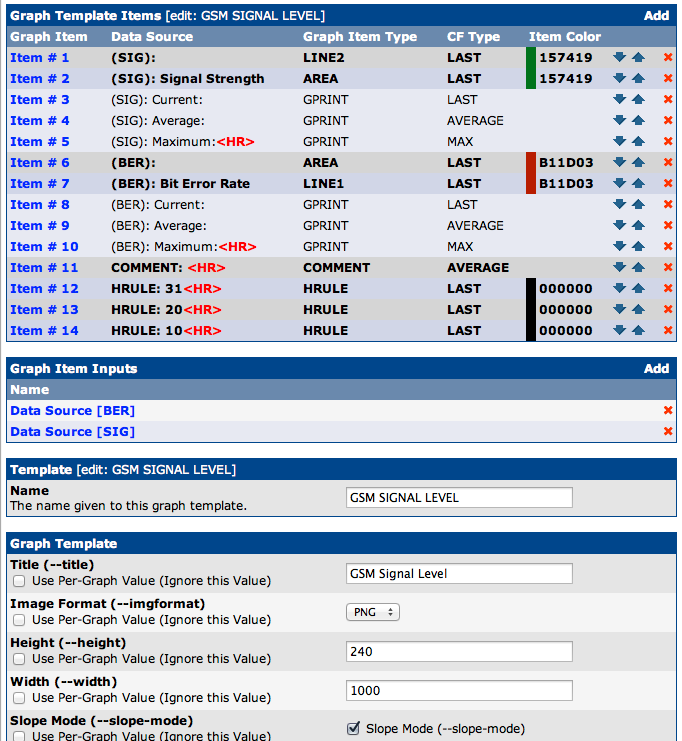
Next – we need a graph template. As before click on Graph Templates on the sidebar and then select Add. Name the template and the graph title, then click 'Create'. Now we need to add some Graph Template Items. Click Add – then all being well you should be able to see the two data sources we created earlier. Select them in turn and make sure that you change the Graph Item Type to something other than COMMENT – LINE1 perhaps. Put something descriptive in the Text format field. Create that and then return to do the second Data source. Once you've got it going then other bits can be added to jazz it up – here's my finished template, with shading under the drawn data points and lines drawn (HRULES) to represent the various signal levels:
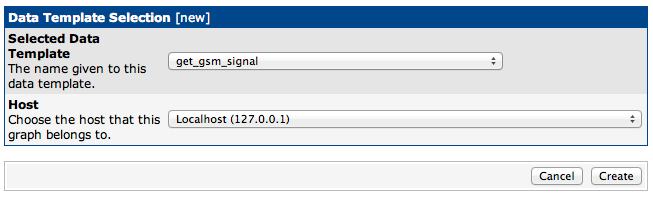
Now – add the data source to the server – I'm using localhost here so just select the template and the host then press Create and Save.
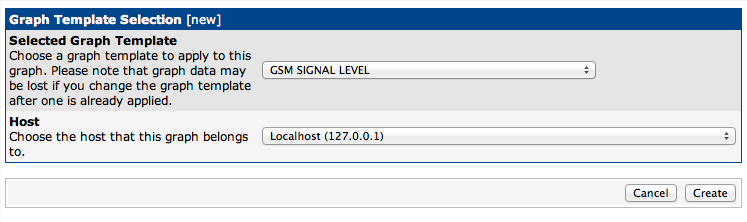
Almost there ! Next step is to create the graph itself. Click on 'Graph Management' on the sidebar, then 'Add'. Pick your template and host and press Create !
Wait for some poller intervals to pass – you can turn the cacti logging up to see if there's any errors – however all being well you should start to see some output:
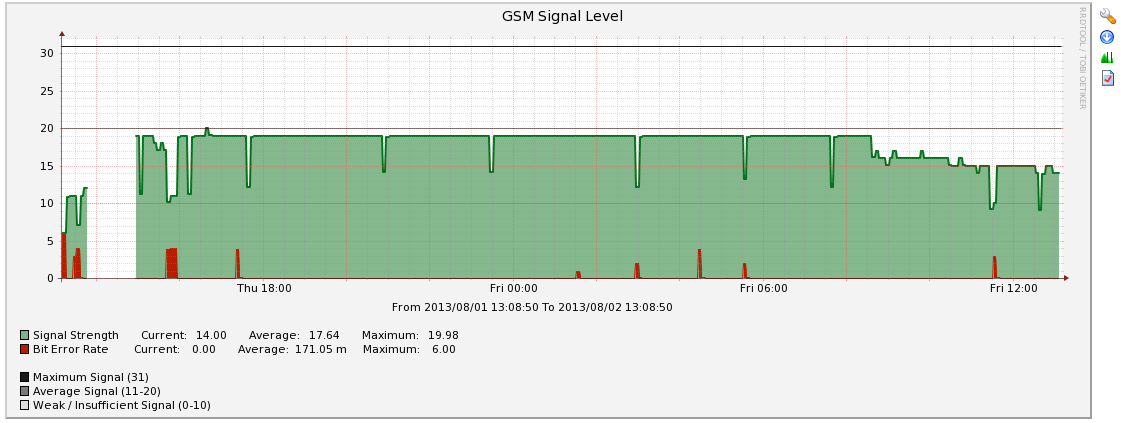
Nice ! So it turns out that the signal is occasionally poor. Time to order a bigger antenna….
* sysadmin-grade perl: mostly works. unfathomable about 10 seconds after it's written. entirely non-portable 🙂